Retail Analytics
Customer Analytics
From customer counting to demographic analytics (age groups, gender, facial expressions), customer flow analysis, promotion success evaluations and queue management - we offer a large variety of smart analytics applications tailored to your needs.
Our CAbIS analytics suite is a fundamental toolset for all companies that want to better understand their customers, provide better customer service, and realize a higher per capita performance.
The CAbIS toolset consists of different modules that can be flexibly combined:
- Customer count (stationary)
- Customer flow analysis (dynamic)
- Heat Maps
- Sales promotion efficiency analysis / service level analysis
All CAbIS tools are LAN-compatible and scalable. A comprehensive reporting system is part of each module.


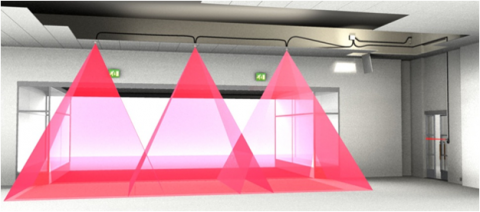
Module 1: Customer frequency counting.
We rely on various technologies for customer frequency counting, from LED light barriers to video sensor technology. The most suitable technology depends on the respective requirements:
- Accuracy of the count (overhead systems beat photocells)
- Bi-directional or multi-directional count
- light effects
- scalability
We count and measure, correlate and provide you with the data in any form, as raw CSV files or comprehensive management reports – just as per your preference.
Module 2: Customer Flow Analysis & Sales Promotion Efficiency Measurement.
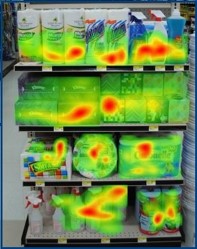
Which parts of your shop do your customers target, which ones do they ignore? How can you make better use of these movement patterns for your business? How effective are promotional displays and which products are lifted up and for how long? With our CAbIS heat map analytics we have answers to all these questions.
Depending on the requirements, different technologies are used. Most often 3D video sensors are part of our solution, especially since IR sensors usually do not allow a sufficiently precise analysis. For movement patterns and counts or regular customer analyses we primarily use anonymized wifi/Bluetooth signal evaluation technologies, occasionally MAC address tracking, in addition to KINECT and video detection. All analysis tools work on an anonymous basis and are used in strict compliance with the respective data protection laws.
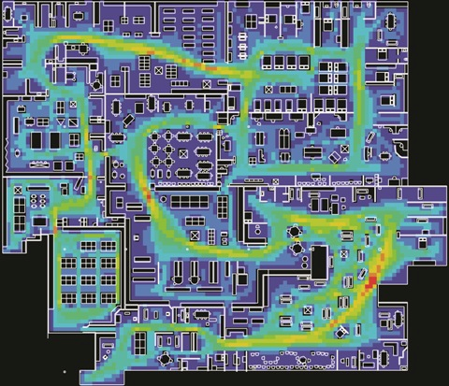
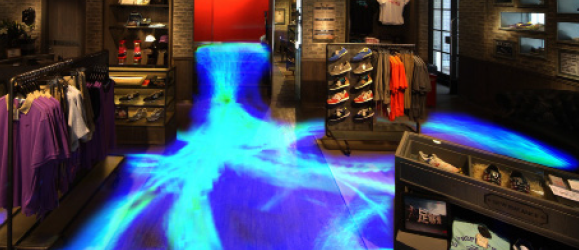
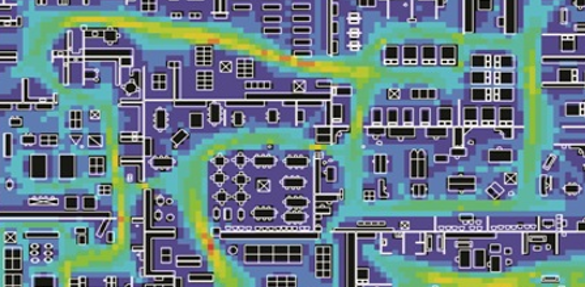
CAbIS WLAN Customer Flow Analysis
The CAbIS customer flow analysis based on wifi is a core element of our tracking solutions. Using special receivers mounted on the ceiling or walls of the store, we assess signals that are constantly emitted by your customers' mobile devices in terms of strength and direction, even if the devices are not logged into a network. We determine the exact position and the customer routes via so-called cross-referencing. In our database, these signals are then converted into route statistics and hotspot statistics that can be retrieved in almost real time.
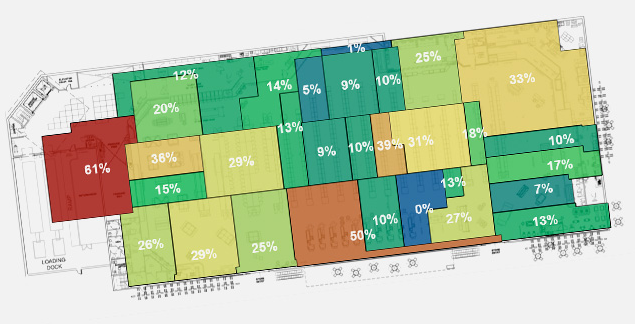
CAbIS Video Customer Flow Analysis
If a more precise analysis of the customer movement data is required than is possibleby using wifi signal detection, our 3D video sensor analysis is the ideal solution. Depending on the ceiling height, 3D video sensors are located at a distance of approx. 3-8m across the entire sales area. These sensors are connected to the decentralised distributors via PoE and receive their power supply via PoE. From there, all data flow to the store server, which carries out the store analysis and transfers the data to the cloud. The data accuracy here is beyond 95%, and spatial coverage can be determined with an accuracy of 30cm.
Shelf efficiency analyses
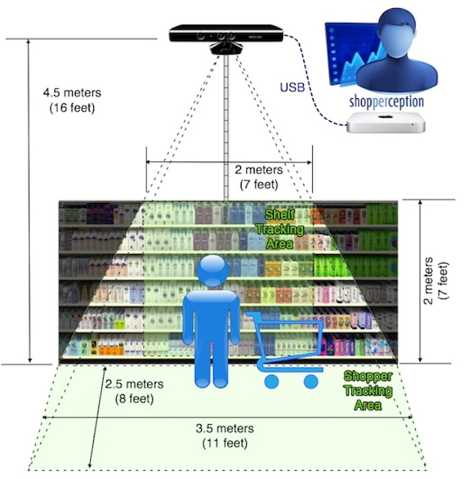
With the help of the KINECT sensor technology, we precisely record every hand movement on the shelf, regardless of the gripping height. The data is fed into our analytical software and allows us to monitor the success of promotions or shelf optimisation campaigns, for example. Again linked to the sales information, we create scorecards for products and campaigns, provide valuable information for product range expansions or alternatively for discontinuations due to re-sorting.

Customer profile analysis
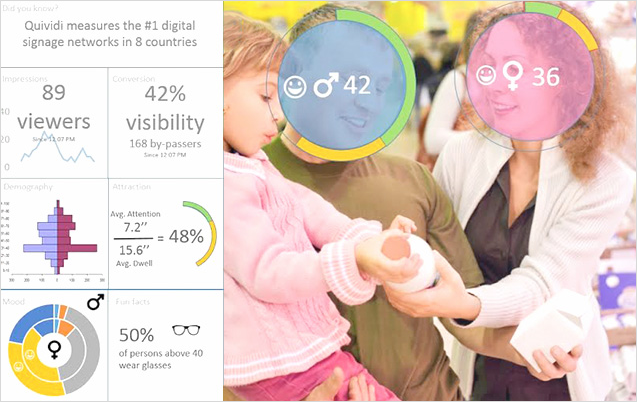
Based on mini-webcam detection technologies, we determine demographic customer profiles such as gender and age groups, but also mood profiles (positive/negative, good mood, etc.). We also records the length of time spent at any specified display or shelf space.
Like all other tracking data, the findings flow into a generic database, which enables further success-critical customer behaviour evaluations via correlative aspects.
Module 3: Wait queues management (queue management).
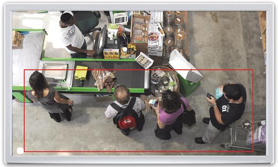
Whether at the checkout or at the service point, the patience of waiting customers quickly finds its limits, and the negative effect on customer satisfaction and corporate image is lasting. On the other hand, it is equally a matter of cost-efficient staff deployment planning. Maximum customer satisfaction with minimum distribution time is a magic formula that can be solved with our CAbIS tools.
Our queue management systems work on the basis of video sensor technology, which is combined with other physical sensors. The data is run through correlation algorythms to turn a static snapshot (number of waiting customers) into a dynamic evaluation, and thus indicating to the operational management whether more or less personnel is required, or whether the situation will regulate itself shortly due to a decreasing footfall in the store.

Modul 4: Reporting.
"You only can manage what you can measure." This well known principle applies to customer flow analysis, too. Our CAbIS tools are designed with this in mind.
Whether you only count customers who enter your store, or link this data with other information, our statistics tools provide you with impressive reports - on demand or fully automated. From "opportunity to see" (OTS) to dwell time analytics and every form of interaction. If desired, we can also record all clicks on touch screens, tablets and mobile apps, or measure interactions using infrared, gyro or other sensors. And from the data collected in this way, we build meaningful correlations and dashboards that help you at a glance, to align your business even closer with the needs of your customers, thus increasing sales and contribution margin.
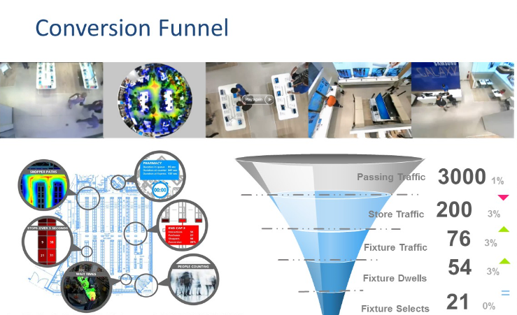
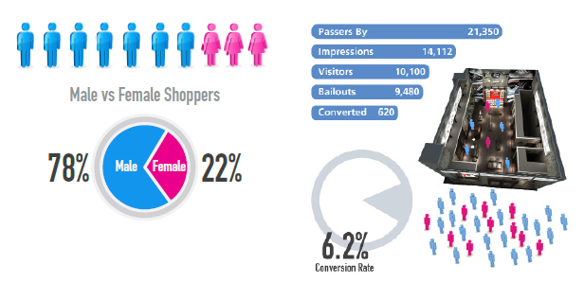


Is brick-and-mortar retailing really so much at a disadvantage compared to online retail because it cannot measure customer desires sufficiently well? We are adamant that this does not have to be the case - of course in strict compliance with all relevant data and consumer protection legislations. Depending on the requirement profile, we use different sensors and correlate this data to create an overall picture that provides you with the following information, among other things:
- Number of customers and heat maps at any time and for individual stores or for the total number of stores
- Length of stay, number of regular customers and their retention time
- Interactions e.g. via beacons, apps, sensors and touch screens
- Demographics (under the law)
We not only do prepare this data and forward it to your IoT platform via SQL databases, we also correlate the data with other BI-data sources, e.g. weather data, POS data, etc.
And if that is still not enough for you, we will set up our solutions right at the beginning of the customer journey. Using intelligent cross-device targeting technology, we provide you with information about the topics your customers have shown interest in while online before visiting your shops. Of course, anonymously, but with interaction logic, thus ensuring the customers are individually targeted and approached based on their interests.
